When a distributor is vetting a supplier for a tender or long-term contract, “we can scale” is not evidence. The question is not whether a factory claims it can handle a surge. It is whether documented metrics show it already has.
This post compares four capacity-proof frameworks procurement teams and purchasing managers use to evaluate wound care manufacturers: OEE trend data, redundancy architecture, First Pass Yield under load, and VMI program structure. We then look at how SLK Medical’s surge protocol holds up against each dimension.
Key Takeaways
OEE trends over time matter more than a single snapshot score. Look for sustained performance above 78% with visible ceiling room.
Redundancy value depends on whether backup capacity is pre-qualified, not just theoretically available.
FPY collapse under volume increase is the most common failure point suppliers hide. Ask for yield data at peak output, not average output.
VMI commitments convert a supplier’s theoretical buffer stock into a contractual fill-rate obligation tied to your consumption data.
SLK Medical’s surge protocol addresses all four dimensions, with scheduled capacity reviews, dual-line qualification, and documented FPY performance tracked across production batches.
Why “Capacity Claims” Need a Proof Standard
During the COVID-19 pandemic, medical device buyers learned a painful lesson: a factory that runs well at normal volume can fail badly under a 2x demand spike. McKinsey’s medtech capacity analysis documented how production bottlenecks invisible at baseline output became critical failures when volume doubled. Adding shifts revealed equipment constraints. Equipment constraints exposed quality vulnerabilities. Quality holds wiped out the throughput gains from extra labor.
For overseas wound care distributors managing hospital and clinical accounts, a supply interruption is not just a logistics problem. It is a contract risk, a bid disqualification, and a patient-care failure bundled together.
Distributors who ask the right questions before signing — rather than discovering problems during a shortage — consistently outperform those who rely on factory visit impressions and quota commitments alone.
Framework 1: OEE Trends
What it measures: Overall Equipment Effectiveness tracks availability (is the line running?), performance (how fast versus theoretical maximum?), and quality (what fraction of output passes first time?). The formula is A × P × Q.
Industry benchmarks: According to 2025 Godlan data covering 1,470+ US discrete manufacturing operations, medical device manufacturers average 78.2% OEE — the highest-scoring discrete sector in the dataset. Best-in-class wound care manufacturing facilities reach 83–88%. Sites stuck below 70% are running with significant unresolved loss categories.
What to ask for: Monthly OEE trend data, not a point-in-time number. A supplier showing a steady 79–82% OEE over 18 months is fundamentally different from one showing 84% for one quarter and 71% the next. Trend stability indicates process control. Erratic scores point to unresolved maintenance or material problems that will surface under surge demand.
What OEE alone does not show: Ceiling room. A line running at 80% with a validated surge plan to reach 90% by adding a second shift is very different from a line at 80% with no documented path to more output. Ask for the surge scenario model, not just the historical score.
Comparison signal: A supplier that can share monthly OEE by production line, broken down by availability, performance, and quality losses, has instrumented its operations at a level that supports serious capacity conversations. A supplier that can only offer an aggregate annual figure is probably not tracking at the granularity needed to predict surge behavior.
Framework 2: Redundancy Architecture
What it measures: The degree to which production capacity, raw material supply, and key equipment are duplicated so that a single failure does not stop output.
The three-layer model:
Redundancy Layer | What It Covers | Proof to Request |
|---|---|---|
Equipment | Backup lines, spare critical components | Line validation records, equipment maintenance logs |
Shifts | Documented ability to move from 1-shift to 2-shift or 24/7 | Shift expansion protocol, labor plan |
Supply chain | Dual-sourced raw materials, safety stock depth | Supplier list (at least two per critical input), stock level data |
During COVID-era ventilator scale-up, Medtronic moved its Galway facility to 24/7 operations by adding shifts and transferring staff from other sites. Vyaire Medical reoptimized its production line before adding shifts and achieved roughly a threefold production increase. Both companies had documented paths to additional capacity before the surge happened. Neither was improvising.
The pre-qualification test: Backup capacity that has never been activated is not redundancy. It is aspiration. The key question is whether secondary lines are validated under ISO 13485 or FDA process requirements, and whether those validations are current. An unvalidated backup line cannot legally produce medical devices without re-validation — and that takes time a surge scenario does not provide.
Comparison signal: Ask for the capacity expansion protocol document, not just an assurance that backup capacity exists. If the supplier cannot hand you a documented procedure for activating surge production within a defined timeframe, that response is itself data.
Framework 3: First Pass Yield Under Load
What it measures: FPY tracks the percentage of units that pass quality inspection on the first production pass, without rework or scrap. The “under load” qualifier matters enormously.
Why surge conditions degrade FPY: When a factory adds shifts, runs equipment longer, or brings in temporary labor, three things typically happen to quality: process drift increases, inspection coverage per unit falls, and fatigue-related errors rise. A supplier with a 97% FPY at normal output may show 91% FPY during a surge run. That 6-point drop means rework costs, delayed shipments, and — in a regulated medical device context — potential lot holds and CAPA investigations.
What to ask for: FPY data correlated with output volume. A scatter plot or table showing FPY at different daily production rates tells you where the quality cliff is. Most suppliers share only average FPY. Distributors who negotiate for volume-correlated data have much better visibility into real surge risk.
The rework trap: Rework does not show up in FPY — only in total unit cost and lead time. Some suppliers mask FPY degradation by reworking units before final inspection counts. Ask specifically whether FPY figures include or exclude reworked units.
ISO 13485 connection: Under ISO 13485, manufacturers must maintain documented procedures for monitoring and measuring product quality, including criteria for detecting quality holds. A supplier operating under a current ISO 13485 certification with documented surveillance audits has at least a process framework for catching quality degradation. Absence of such documentation is a clear risk signal.
Comparison signal: Request FPY data from the highest-output months in the past two years. If the supplier cannot identify which months represented peak output and what the corresponding FPY was, they are not tracking quality at the granularity needed to manage surge risk.
Framework 4: VMI Program Structure
What it measures: Vendor Managed Inventory shifts replenishment responsibility to the supplier, who monitors consumption data and maintains agreed stock levels at the distributor’s warehouse or regional hub. For surge capacity purposes, VMI converts a theoretical buffer into a contractual commitment.
Why VMI matters for distributors specifically: Traditional replenishment puts the distributor in a reactive position: when stock falls below reorder point, a purchase order goes out, and lead time begins. During a demand spike, that lead time is exactly when emergency orders pile up from customers. VMI inverts the dynamic. The supplier watches actual consumption trends, anticipates the spike, and ships proactively — before the distributor’s stock hits critical levels.
Measured outcomes from healthcare VMI implementations:
36–70% inventory reduction at the hospital/distributor level (Thai hospital system study, 2024)
Fill rates above 98% OTIF in well-structured programs (LMA Consulting Group VMI benchmark)
85% reduction in annual shipments in one medical device VMI deployment (Boston Scientific EU program)
Stockout reduction of approximately 30% compared to traditional replenishment models
What a VMI commitment actually requires: The supplier needs real-time or near-real-time consumption visibility (EDI, portal, or RFID), a defined replenishment trigger methodology, documented SLAs on restocking lead times, and escalation procedures for surge events. A supplier that offers “VMI” without those components is describing a spreadsheet arrangement, not a managed inventory program.
Comparison signal: Ask for the VMI service-level agreement template before signing. The SLA should specify fill rate targets, maximum restocking lead time, escalation thresholds, and what happens if the supplier fails to meet them. No SLA template means the program is informal and the commitments are unenforceable.
SLK Medical Surge Protocol: A Comparative Case
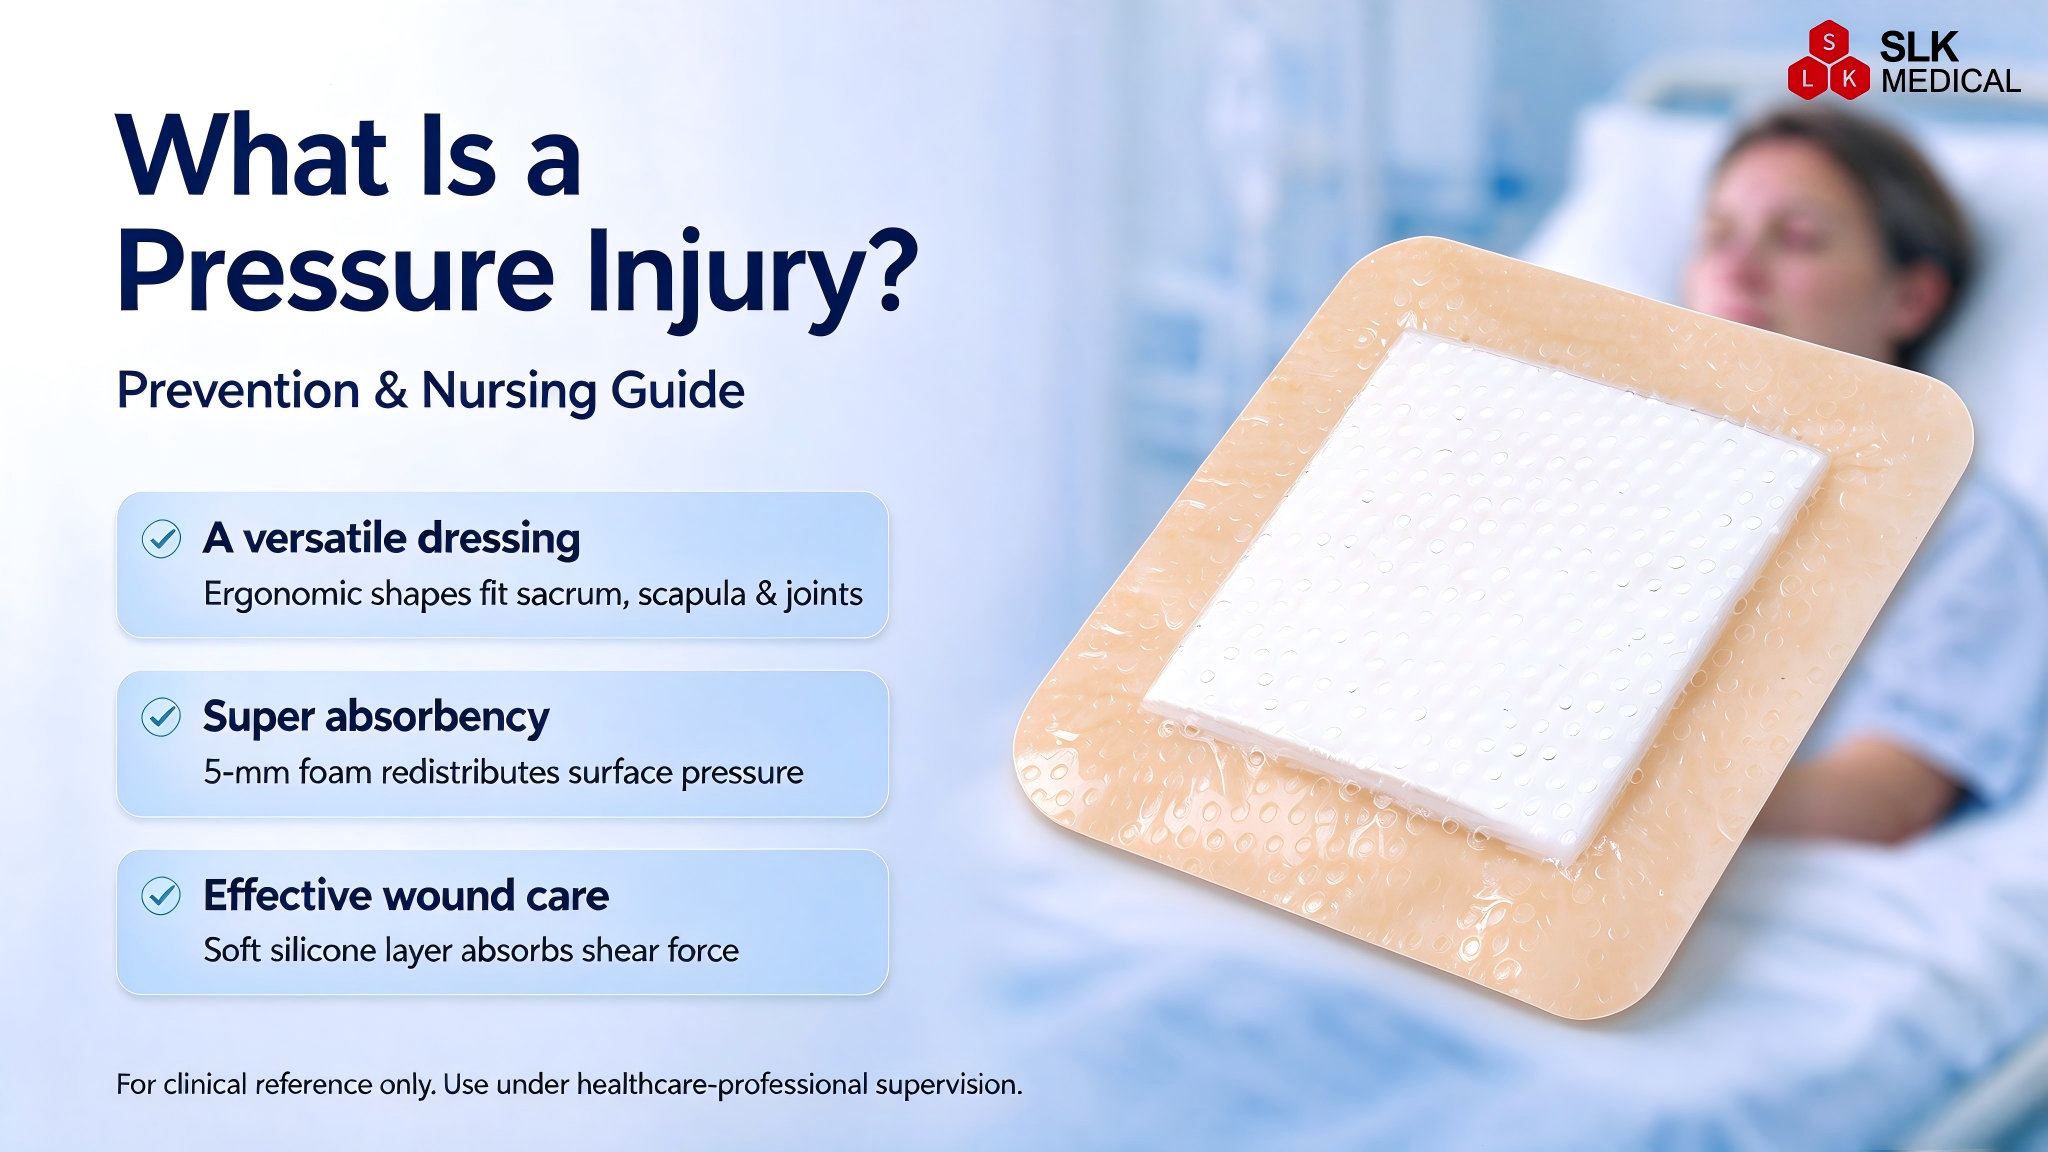
SLK Medical manufactures advanced silicone foam wound care dressings including antimicrobial silver (Ag) and super absorbent formats. Here is how its operations map against the four frameworks.
OEE: Production lines are tracked monthly by line and by loss category. Scheduled capacity reviews include OEE benchmarking against the medical device industry average (78.2%), with documented procedures for identifying and clearing bottleneck constraints before they affect customer delivery commitments. The review cycle allows early identification of performance decay before it reaches distributors.
Redundancy: SLK Medical maintains dual-line qualification for its core silicone foam formats. Each production line operates independently, with separate validated equipment, so a maintenance hold on one line does not stop shipment. The shift expansion protocol covers a move from standard operations to extended runs, with documented labor activation and raw material release procedures tied to demand thresholds.
FPY: Quality monitoring tracks FPY correlated with output volume across production batches. The data is maintained in the quality management system under ISO 13485 requirements, with CAPA procedures triggered if FPY falls below defined thresholds at any output level. Distributors can request FPY trend reports as part of the technical documentation package.
VMI: SLK Medical offers VMI arrangements for qualifying distributors, with restocking based on actual consumption data shared through agreed-upon data exchange. The program includes defined fill-rate SLAs and escalation procedures for surge events. Distributors handling hospital or clinical accounts with frequent replenishment cycles have the strongest case for VMI activation.
The full capacity proof pack — OEE trend reports, line qualification records, FPY data, and the VMI SLA template — is available as part of the standard documentation request process for prospective distribution partners.
How to Structure Your Capacity Due-Diligence Request
The following checklist covers all four frameworks in one documentation request. Send it before a factory audit, not after.
OEE Documentation
Monthly OEE by production line for the past 24 months
Breakdown by availability, performance, and quality losses
Surge scenario model showing projected OEE at 1.5x and 2x current output
Redundancy Documentation
Equipment validation records for primary and backup lines
Shift expansion protocol with activation timelines
Dual-supplier evidence for top five raw material inputs
Safety stock levels as of most recent inventory review
FPY Documentation
FPY data correlated with monthly output volumes (past 24 months)
Clarification on whether figures include or exclude reworked units
CAPA log showing quality-related investigations at high output periods
VMI Documentation
VMI SLA template with fill-rate targets and restocking lead times
Data exchange requirements and current integration options
Escalation procedure for surge events
Suppliers who can produce this package in under two weeks are organized. Suppliers who cannot are revealing how their quality and operations functions actually interact.
The Bottom Line
Capacity is not a claim. It is a data set.
Distributors who evaluate suppliers on OEE trend stability, validated redundancy architecture, FPY performance under load, and VMI program rigor are making procurement decisions on evidence rather than factory tour impressions. The suppliers worth the long-term partnership are those who can hand over that evidence without hesitation.
SLK Medical’s surge protocol is built against exactly this proof standard. To request the full capacity documentation package, visit slkmedical.com or contact the team through the distributor inquiry page.
SLK Medical manufactures advanced wound care dressings including silicone foam, antimicrobial silver (Ag), and super absorbent formats. ISO 13485 certified. CE MDR and FDA regulatory pathways available for qualifying markets.