


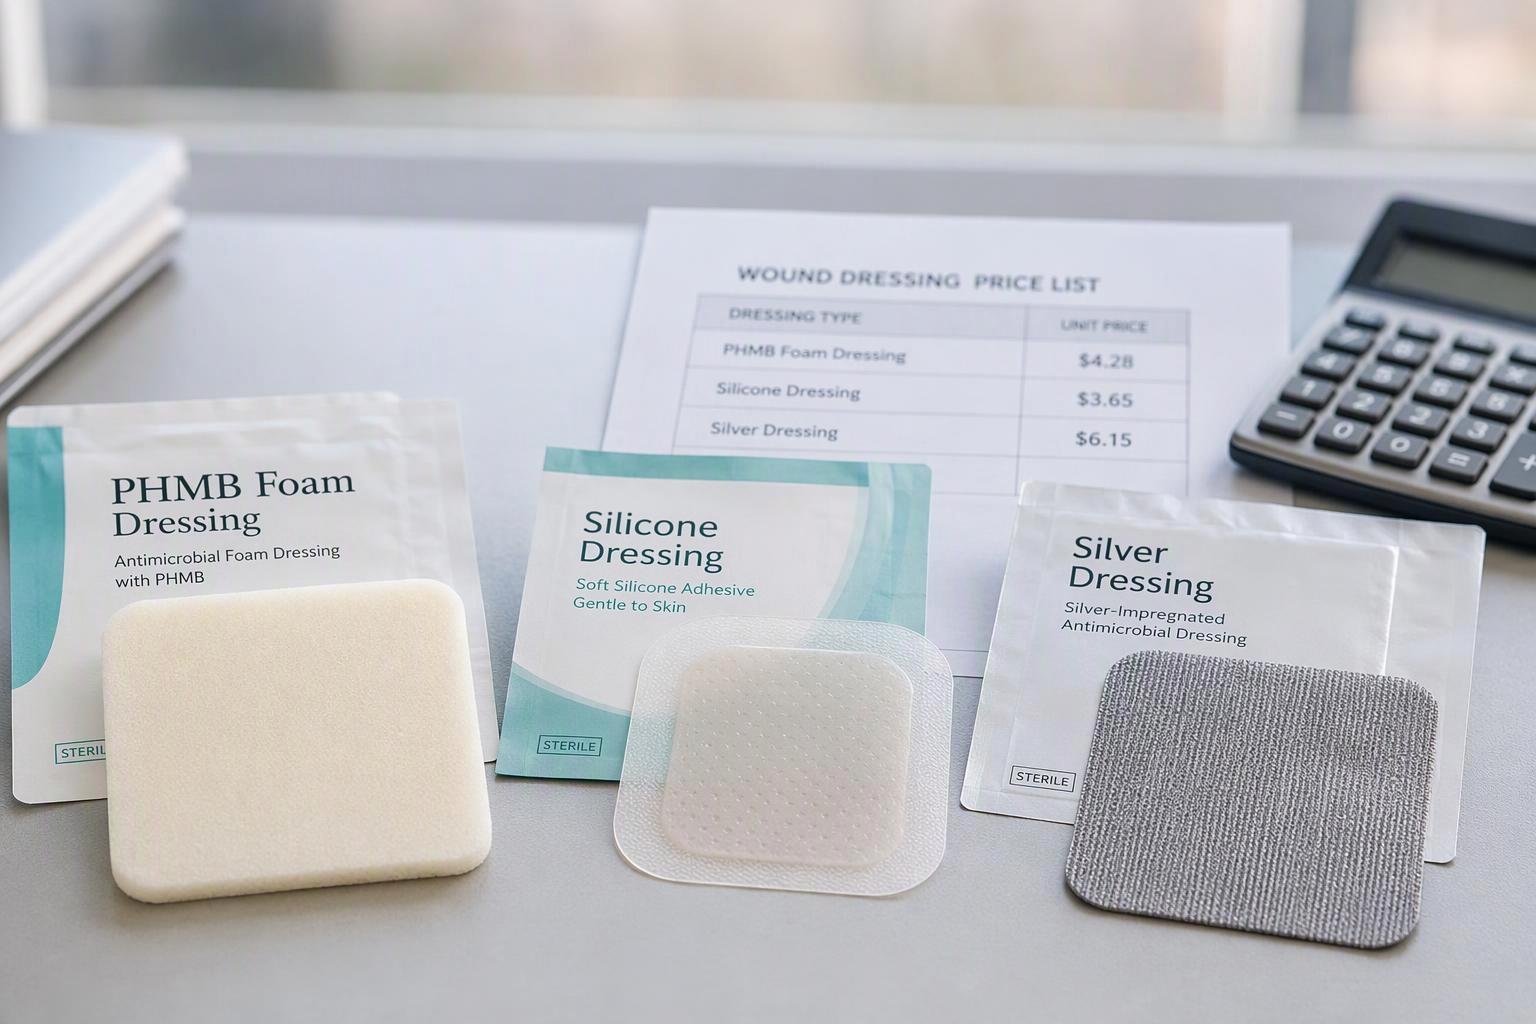
A distributor’s line card and a hospital tender usually arrive at the same shortlist: a PHMB foam, a plain silicone foam, and a silver foam. On the price schedule they sit within a few cents or a few dollars of each other per piece, and the temptation is to rank them there. That ranking rarely survives contact with a ward. The moment you ask how many days each dressing actually stays on, how often it leaks before the scheduled change, and how many clinician minutes each change consumes, the three classes separate — and the cheapest piece price is frequently not the cheapest therapy.
This guide builds a total-cost-of-therapy (TCO) model you can populate with your own quotation, your own IFU, and your own audit data. It is a costing method, not a clinical efficacy ranking; nothing here should be read as a claim that one dressing class outperforms another in healing. The audience is distributors and procurement teams assembling tender submissions, formulary applications, and line-card rationalisation cases. By the end you will have four cost lines, a conversion formula, a probability-weighted leakage line, an SLK Medical SKU matrix, and three sensitivity cases to run before the next tender window.
Key takeaways
Nursing time and hospital costs dominate the total. In a widely cited review of wound-management economics, nursing time and hospital costs together are reported as responsible for around 80–85% of total cost, with dressings accounting for a small share; healing time, change frequency, and complications are named as the three main cost drivers (Lindholm & Searle, 2016). That figure is a modelled apportionment from a particular body of evidence, not a universal constant — but it is the reason this model weights wear time and change frequency far above unit price.
Cost per wound per week is the only comparable unit. A price per piece, a price per pack of ten, and a price per change cannot be ranked against each other until each is converted using achieved wear time.
Leakage and unplanned changes belong on their own line. Folding an unplanned change into the scheduled change frequency inflates the scheduled line and hides the leakage penalty. Model it as a separate, probability-weighted cost.
A labelled maximum wear time is a ceiling, not a default. It is bounded by exudate level, anatomy, and local protocol. Populate the model with locally observed achieved wear time; run the label maximum only as an upper-bound sensitivity case.
Two artefacts carry the argument into committee. The SLK Medical SKU matrix (populated from controlled documents, not memory) and the three-case price–wear-time sensitivity are what a value-analysis committee can actually act on.

What total therapy cost actually measures
Total therapy cost is the full cost of managing one wound for one week, from a stated perspective, across four cost lines. The perspective matters before any arithmetic: a hospital’s budget view, a payer’s view, and a distributor’s margin view are three different models built from overlapping inputs. A distributor calculating landed cost plus margin will exclude clinician labour that the hospital bears; a hospital business case will exclude the distributor’s margin. State the perspective at the top of the spreadsheet, because it determines which lines are in scope and which are somebody else’s cost.
The four cost lines and what belongs in each
Cost line | Include | Exclude (or place elsewhere) |
|---|---|---|
1. Primary dressing | Unit price ÷ achieved wear time, expressed per week; wastage from sizes cut or discarded | Secondary dressings, fixation |
2. Secondary supplies and fixation | Secondary absorbent pad, fixation tape or bandage, border products, cleansing solution, barrier and remover wipes, gloves, waste disposal | Items already bundled into a bordered primary dressing |
3. Leakage and unplanned changes | Full cost of each unplanned change (dressing + secondary supplies + clinician time), plus cascade items: linen change, extra skin care, periwound treatment | Scheduled changes, which sit in lines 1, 2 and 4 |
4. Clinician time | Minutes per change × local loaded hourly rate, for scheduled and unplanned changes separately | Travel time unless the perspective is a home-visiting provider — in which case it must be added, not ignored |
The items most often omitted are the ones that fall outside the dressing budget: travel time on home visits, and the linen and skin-care cascade after a leak. Both are real costs to somebody, and both are systematically larger for dressings that leak. If the perspective is a provider, include them; if it is a distributor, note them as a provider-side cost in the business case rather than pretending they do not exist.
Why dressing unit price is the weakest input
The ranking of cost drivers rests on the same review: dressings are a small share of total wound-management cost, while nursing time and hospital costs together account for roughly 80–85% (Lindholm & Searle, 2016). A separate UK audit-based costing reached a compatible conclusion from a different direction, estimating nurse time at around 33–41% of total wound-care cost and finding that a minority of patients treated in hospital accounted for between 37% and 49% of total cost (Drew et al., 2007). The same audit named frequency of dressing change, incidence of wound complications, and wound-attributable admission and delayed discharge as the key cost drivers to refine.
Two cautions on that evidence. First, the 80–85% figure is a modelled apportionment drawn from a particular set of studies, not a measured constant that will reproduce in your market. Second, the Drew audit costed nurse time at 2005–2006 prices (£19 per community dressing change, £38 per hour of hospital patient contact) — useful for the structure of the calculation, useless as a current tariff. Use the published work to justify the weighting of the model, and your own local rates to populate it.
How to convert a unit price into cost per wound per week
The conversion is a single denominator applied to every per-change cost. Once you can state cost per wound per week, a per-piece price and a per-change price become comparable.
The base formula, step by step
Let:
P = primary dressing unit price (your quotation, per piece)
W = achieved wear time in days (local observation, not the label)
S = secondary supplies and fixation cost per change
M = clinician minutes per change
R = loaded hourly rate for the clinician performing the change
L = expected unplanned changes per week (derived in the next section)
C = cascade cost per unplanned change (linen, extra skin care)
Then:
Scheduled cost per week = (P + S + M/60 × R) × (7 / W)
Unplanned cost per week = L × (P + S + M/60 × R + C)
Total therapy cost per wound per week = Scheduled + Unplanned
The denominator is explicit: 7 / W is the number of changes per week implied by achieved wear time. Every per-change item is multiplied by the same factor, so the arithmetic is auditable line by line. Keep all currency in one unit and all time in days and minutes; mixing a per-pack price with a per-piece wear time is the most common source of a wrong answer.
Worked example with labelled illustrative inputs
Every figure below is an illustrative value for method demonstration only. None is an SLK Medical list price, a local tariff, or a published rate.
Assume: P = 4.00, W = 3 days, S = 1.20, M = 15 minutes, R = 40.00 per hour, L = 0.5 unplanned changes per week, C = 2.00.
Changes per week = 7 ÷ 3 = 2.33
Per-change cost = 4.00 + 1.20 + (15 ÷ 60 × 40.00) = 4.00 + 1.20 + 10.00 = 15.20
Scheduled cost per week = 15.20 × 2.33 = 35.47
Unplanned cost per week = 0.5 × (15.20 + 2.00) = 8.60
Total = 44.07 per wound per week
The split is the point: dressing cost contributes 4.00 × 2.33 = 9.33, or about 21% of the total, while clinician time contributes 10.00 × 2.33 = 23.33, or about 53%. Change W from 3 days to 5 and the scheduled line falls to 21.28; change it to 2 and it rises to 53.20. The unit price never moved. That ratio — dressing cost as a minority share of the total — is what the model exists to expose, and it is consistent in direction with the published apportionment even though the illustrative numbers are invented.
Modelling leakage and unplanned changes without double-counting
An unplanned change is not a more frequent scheduled change. It is a different event with a different trigger, a different cost profile, and often a different clinician at a different time of day.
Scheduled versus unplanned: two separate lines
A scheduled change is driven by protocol or the planned interval: the dressing has reached its intended wear time and is replaced as planned. An unplanned change is driven by something going wrong or being checked early — strikethrough, loss of adhesion, saturation, leakage, or clinical review.
A retrospective audit of 40 patients and 55 wounds, combined with interviews of 12 clinicians, recorded wound inspection and adherence to protocol as the primary reasons for change, with loss of adhesion, dressing saturation, patient non-concordance, and leakage also reported — though none of those secondary reasons was stated in more than two cases (Blackburn et al., Wounds UK 2018). That distribution is itself a finding: in routine records, most changes look scheduled because the reason is rarely documented in detail. It is also why retrospective data cannot tell you how well a dressing adhered or controlled exudate — the audit notes that dressing-performance documentation was largely absent, making true evaluation of adherence, exudate control, and maceration prevention impossible from those records alone.
If you count an unplanned change inside the scheduled frequency, two things happen: the scheduled line is inflated by changes that were not scheduled, and the leakage penalty — the cascade cost, the after-hours labour premium, the skin damage — disappears from the model entirely. The dressing that leaks most looks artificially cheap.
A probability-weighted unplanned-change rate
The expected unplanned-change count per week is:
L = p × (7 / W)
where p is the probability of an unplanned change within a single wear interval, and 7 / W is the number of intervals per week. If p = 0.2 and W = 3, then L = 0.2 × 2.33 = 0.47 unplanned changes per week. Add the full cost of each — dressing, secondary supplies, clinician time, and cascade items — as its own line, as in the worked example above.
Two cautions. First, p must come from local audit or from a supplier-provided evaluation; a made-up probability produces a precise-looking total that means nothing, and a committee that discovers the number was invented will discount the whole model. Second, p is not necessarily constant across wear intervals: a dressing worn longer has more opportunity to leak, so if you extend W in a sensitivity case you should consider whether p rises with it rather than holding it fixed. The downside case in the sensitivity protocol below does exactly that.
Secondary supplies, fixation, and disposal in the total
Secondary supplies are small per item and large per week, and they are the line that most often decides the ranking between a borderless and a bordered format.
What to include and how to allocate it
Carry these items: fixation tape or bandage, secondary absorbent pad, barrier wipe, adhesive remover wipe, cleansing solution, gloves, and waste disposal. Allocate each per change, not per week, so the items scale correctly when wear time changes — a dressing worn for five days consumes fewer secondary items than one worn for two, and a per-week allocation would hide that.
The published dressing-selection guidance is explicit that low-adherence, low-absorbent dressings “require secondary dressings for absorbing exudate – added cost” (RACGP, Selecting appropriate dressings, 2022). The same source notes that barrier wipes help secure a foam, reduce maceration, and protect skin on removal, and that remover wipes should be used when removing a dressing from fragile skin — both are real per-change costs that belong in line 2.
The borderless-versus-bordered trade-off
The structural trade-off is straightforward once the secondary line is populated. A borderless format may carry a lower unit price, but it requires fixation and often a secondary dressing, and on some anatomies it carries a higher leak probability. A bordered format bundles fixation into the unit price: higher P, lower S, and often lower p. Whether the bundle wins depends entirely on the local numbers — which is why the model must carry S explicitly rather than assuming it away.
The format choice is also partly anatomy-driven, not purely economic. The same guidance states that silicone foams on the foot, if applied, should be without borders and anchored with tape or bandages (RACGP, 2022). On a heel or a plantar surface, the borderless format may be the clinically appropriate choice regardless of what the cost model says; the model’s job is then to show the true total cost of that choice, not to overrule it.
When two products carry different labelled maximum wear times
This is where most dressing comparisons fail. Two products with different labelled maximum wear times are not comparable on the label; they are comparable only on achieved wear time under matched conditions.
Label maximum versus achieved wear time
The IFU-stated maximum is a ceiling set by the manufacturer for the conditions the device was tested and cleared for. Achieved wear time is what actually happens on the ward or in the home, and it varies by wound type. The Wounds UK audit found that mean wear time for pressure ulcers fell gradually after the second dressing change — changes became more frequent — and was generally lower than for other wound types, while mean wear time for chronic lower-limb wounds remained reasonably constant through the analysis period (Blackburn et al., 2018). That is direct evidence that achieved wear time is wound-type-specific, and it is why a single wear-time figure applied across a whole product line will mislead.
Populate the model with locally observed achieved wear time for the specific wound type and care setting. Run the label maximum only as the upper-bound sensitivity case, clearly labelled as such.
Matching the comparison conditions
Two products may be compared only on the same wound type, the same exudate level, the same care setting, and the same change protocol. A cost-per-week figure for a pressure ulcer in a nursing home is not a valid comparator for a venous leg ulcer in a clinic — the wear times, the labour rates, and the leak probabilities all differ. Cross-wound-type comparison of cost per week is not a comparison of products.
There is a further constraint from the interview data in the same audit: clinicians described changing a dressing during an already-scheduled visit because it was more practical than returning the next day. As one participant put it, if the wear time can only be extended by a day and the nurse is already there, “they might as well change that dressing there and then rather than come out and do another visit the following day” (Blackburn et al., 2018). This compresses the apparent benefit of a longer wear time: if the visit schedule, not the dressing, sets the change interval, a longer-wearing product saves nothing in labour. Model your local visit logistics explicitly, because in a home-visiting service they can dominate the wear-time effect entirely.
The SLK Medical SKU matrix
The matrix is a procurement instrument, not a catalogue. Its purpose is to hold, in one auditable grid, every attribute the cost model depends on — and to make clear which cells are supplier-declared and which are your own observations.
Matrix structure and column definitions
Rows are dressing families and formats. Columns are:
Column | Source | Note |
|---|---|---|
Family and format (bordered / non-bordered / variant) | Specification sheet | Confirm against the current product page or spec sheet |
Antimicrobial agent (PHMB / silver / none) | IFU and specification sheet | Record the agent, not a performance claim |
Intended exudate level | IFU and specification sheet | Must match the wound cohort you are costing |
Stated maximum wear time | Current IFU | A ceiling; never enter as achieved wear time |
Fixation requirement | IFU and specification sheet | Drives the secondary-supplies line |
Certification status and scope | Certificate pack | See below |
Unit price | Your commercial quotation | Never from memory or a competitor’s published claim |
Achieved wear time | Local observation | Wound-type-specific |
Unplanned-change probability | Local audit or supplier evaluation | The input most worth collecting |
No cell should be filled from memory, from a sales conversation, or from a competitor’s published claim. Price and wear-time cells in particular are populated from your own quotation and the current IFU, and the achieved-wear-time and probability cells from your own records.
Families in scope for this comparison
SLK Medical’s range maps onto the PHMB / silicone / silver comparison as follows:
PHMB silicone foam, in bordered and non-bordered formats. The bordered product is described as a sterile antimicrobial wound dressing containing polyhexamethylene biguanide (PHMB, polihexanide) in the foam. Treat the antimicrobial description as a product attribute to be verified against the IFU, not as a clinical claim.
Silicone foam, including bordered (skin-colour and pink), non-bordered, border-flex, lite, and transfer variants. These are the non-antimicrobial comparators in the matrix.
Silicone foam Ag, in bordered and non-bordered formats, plus a non-adhesive Ag foam. These are the silver comparators.
Super-absorbent dressings, silicone-adherent and non-adherent, for high-exudate cases. In this model these usually function as a secondary or high-exudate option rather than a like-for-like substitute for a primary foam, and should be costed in the secondary-supplies line or in a separate high-exudate cohort — not swapped into the primary-dressing row.
Certification and documentation columns
Record the first-party certification position with its scope, not as a badge. SLK Medical Material (Tianchang) Co., Ltd. holds ISO 13485:2016 certification from TÜV SÜD Product Service GmbH under certificate Q5 112764 0001 (current revision 01, report SH26185902, valid 2026-06-30 to 2028-05-08; the superseded revision 00 ran 2025-05-09 to 2028-05-08). The scope covers design, development, production and distribution of sterile polyurethane, gelling fiber and super-absorbent dressings, and production and distribution of sterile foam, transparent, waterproof, hydrocolloid, alginate and silicone absorbent fiber dressings, plus non-sterile scar gel, medical tape, silicone gel sheets and silicone tapes.
The company also holds an EU quality management system certificate under Regulation (EU) 2017/745, Annex IX Chapter I, certificate G15 112764 0002 (Rev. 00, report SH23185901, valid 2025-09-23 to 2030-09-22), issued by TÜV SÜD Product Service GmbH as Notified Body 0123. Its device group is M040101 — adhesive dressings with absorbent pad — classified Class IIb, with an intended purpose covering a range of exuding wounds including pressure ulcers, leg and foot ulcers, traumatic and surgical wounds, and skin tears.
Two things must be said plainly. These are quality-management-system certificates, not device-specific conformity certificates; device conformity, classification, and intended purpose must be confirmed against the current certificate scope and the technical documentation for the specific product, not assumed from the QMS certificate. And certificate validity should be verified directly against the issuing body’s public lookup before it goes into a tender pack.
Price–wear-time sensitivity: three cases to run before a tender
A single point estimate invites the objection that you picked the assumptions that suited your preferred product. Three cases, run on the same model with only two inputs varied, answer that objection before it is raised.
Case design: base, downside, upside
Case | Achieved wear time | Unplanned-change probability | Everything else |
|---|---|---|---|
Base | Locally observed achieved wear time | Locally observed p | Quoted price; local labour rate; local secondary costs |
Downside | Below the label and below local average | Raised, reflecting the longer exposure per interval | Held fixed |
Upside | At the label maximum | Low leak rate | Held fixed |
Hold every non-varied input fixed across the three cases — same price, same labour rate, same secondary supplies, same cascade cost — so the comparison isolates wear time and leak probability. Label every input as illustrative or local, and state which. The upside case at the label maximum is not a forecast; it is the boundary of what the label permits, and presenting it as anything more will be read as advocacy.
Reading the crossover point
The crossover is the wear-time threshold at which the ranking flips. Solve for the W at which two products’ total cost per wound per week are equal, holding all other inputs fixed. Above that threshold the higher-priced dressing is the lower-total-cost option; below it, the cheaper unit price stops compensating for the extra changes.
Present it as one number, not a wall of scenarios: “At the quoted prices, the higher-priced dressing becomes the lower total-cost option once achieved wear time exceeds X days on this wound type; below X days, the lower-priced dressing remains cheaper.” That sentence is what a committee can act on, because it converts the decision into a question they can answer from their own audit data — do we achieve more than X days on this cohort? If the answer is unknown, the crossover tells them exactly what to go and measure.
One structural caution: the crossover is only meaningful if the leak probability is held consistent between the two products at each wear time. If the higher-priced dressing also leaks less, the crossover moves in its favour; if it leaks more, the crossover may not exist at any realistic wear time. Run the crossover inside each of the three cases rather than once on the base case alone.
Building the evidence pack a supplier should provide
The matrix is only as good as the documents behind it. Convert the model’s data requirements into a request list you can issue to any supplier, including SLK Medical, so that every cell is populated from a controlled document rather than a sales conversation.
Documents to request
Current IFU in each language required for the markets you serve — this is the source for stated maximum wear time, intended exudate level, and fixation guidance.
Specification sheet with dimensions, absorption data, and format details.
Certification pack: the ISO 13485 certificate and the EU MDR QMS certificate, including the scope pages, not just the cover.
Declaration of device classification and intended purpose, specific to the product, not the QMS scope.
Sampling and evaluation plan for a local evaluation.
Note that the certification documents referenced in this guide are quality-management-system certificates. Verify current validity directly against the issuing body’s public certificate lookup (TÜV SÜD publishes a lookup at tuvsud.com/ps-cert) before the pack goes into a tender, and check that the revision quoted is the current one — QMS certificates are revised, and a superseded revision in a submission is an avoidable audit finding.
Evaluation and sampling plan expectations
A usable evaluation plan contains: named patients or wound types; a defined evaluation period; recorded wear time and reason for every change; leakage events logged separately from scheduled changes; and a discontinuation rule. Published local wound-product evaluation procedures provide a workable structure for the discontinuation rule — stop at the patient’s request, on any deterioration or reaction attributed to the product (with reporting through the appropriate adverse-event route), if the product proves inferior to the existing formulary option, or at the end of the evaluation period unless improved outcomes justify continuation (South West London ICB wound-management evaluation SOP).
The evaluation must record dressing performance explicitly. The Wounds UK audit found little documentation of dressing performance in routine records, which made true evaluation of adherence, exudate control, and maceration prevention impossible from retrospective data (Blackburn et al., 2018). A prospective evaluation that logs wear time, reason for change, and leakage events is the only reliable way to populate the p and W cells — and those are the two cells that move the answer most.
Presenting the TCO result to a value-analysis committee
The model’s output is a decision document, not a spreadsheet. One page, one unit (cost per wound per week), three cases side by side, the crossover threshold, and an index to the evidence pack.
Structuring the submission
Present in this order:
Decision context — what is being decided, by when, and from whose perspective the costs are counted.
Wound-type scope — which cohort, which care setting, and why the comparison is valid only within it.
Model inputs with sources — every input labelled as local observation, supplier-declared, or illustrative.
Base and sensitivity results — the three cases side by side, in cost per wound per week.
Crossover threshold — the single wear-time number at which the ranking flips.
Non-cost criteria — format fit by anatomy, certification scope, supply reliability, MOQ, and lead time. These are not cost lines and should not be monetised to force a ranking; they are the criteria a committee weighs alongside the cost case.
The requested decision — stated explicitly, with the evidence pack index attached.
State plainly which inputs are local observations and which are supplier-declared. A committee will trust a model with labelled assumptions more than one that presents every number as equally firm.
Handling antimicrobial claims honestly
Keep the clinical rationale in a clearly separated note and out of the cost arithmetic. The cost model treats PHMB and silver identically as cost lines; any difference between them enters only through wear time, change frequency, and secondary-supply requirements.
On the clinical side, three points set the boundary. The International Wound Infection Institute’s 2022 consensus found that identified clinical research on topical antiseptics was predominantly of low certainty, and recommends using a topical antiseptic for at least two weeks before evaluating its efficacy in managing wound infection (IWII, 2022). NICE’s evidence summary advises that silver dressings should be used only when there are clinical signs or symptoms of infection (NICE ESMPB2). And an ex vivo study on porcine skin found that all tested silver dressings elevated DNA-damage and stress markers in skin models, with the authors noting that extrapolation of this cytotoxicity to clinical settings is unclear (Nešporová et al., 2020).
Present PHMB and silver as antimicrobial options within a stewardship framework, cite the evidence at its actual level of certainty, and let the clinical decision sit with the clinical committee. The cost model’s job is to make sure that decision is not distorted by a unit-price comparison that ignores everything else.
Common modelling errors and how to avoid them
Run this checklist against your own spreadsheet before it goes anywhere near a committee.
Unit prices compared across different wear intervals. Two prices per piece are not comparable until both are converted to cost per wound per week.
Unplanned changes double-counted. Check that no change appears in both the scheduled frequency and the leakage line.
Secondary supplies omitted for borderless formats. If S is zero for a borderless dressing, the model is systematically favouring it.
Label maximum used as achieved wear time. Check the W column against your own records, not the IFU.
Labour rate applied inconsistently. Home visits and clinic visits carry different loaded rates and different travel time; using one rate for both distorts the comparison.
Travel time excluded on a home-visiting cohort. If the perspective is a home-visiting provider, travel belongs in the labour line.
A single-point estimate presented without sensitivity. If there is no downside case, the committee will construct one for you.
A probability invented rather than sourced. Check that p traces to an audit or an evaluation, not to a plausible-looking guess.
Certificate revision superseded. Check the certificate numbers and revisions against the issuing body’s current lookup.
Perspective unstated. If the reader cannot tell whose costs are being counted, the total is not interpretable.
Getting started: a five-step implementation sequence
The path from reading to a populated model is shorter than it looks.
Pick one wound type and one care setting. A single cohort — say, pressure ulcers in a home-visiting service, or venous leg ulcers in a clinic — is enough to build and defend the model. Do not attempt the whole formulary at once.
Pull the last quarter’s change records for that cohort. Extract achieved wear time, reason for each change, and any leakage events. Where the reason is undocumented, mark it as such rather than assuming it was scheduled.
Request the evidence pack from shortlisted suppliers. IFU, specification sheet, certification pack with scope pages, classification and intended-purpose declaration, and sampling plan.
Populate the matrix and run the three sensitivity cases. Base, downside, upside, with every non-varied input held fixed and every input labelled.
Take the one-page result to the committee. Decision context, scope, inputs with sources, three cases, crossover threshold, non-cost criteria, requested decision.
The most common hesitation is that local data is too thin to model. It usually is thin — but a model built on stated assumptions and a sensitivity range is more defensible in a tender than a unit-price comparison with no assumptions stated at all. The committee can challenge a labelled assumption; it cannot challenge a number that was never explained. And if the data really will not support even a base case, the crossover threshold gives you the one thing worth measuring next: the wear time at which the ranking flips.
Frequently asked questions
What is total therapy cost for a wound dressing?
It is the full cost of managing one wound for one week from a stated perspective — primary dressings, secondary supplies and fixation, leakage and unplanned changes, and clinician time. It is not the unit price, and it is not the acquisition cost; both of those are inputs to it, and both are minor ones once labour is counted.
How do I compare a dressing priced per piece with one priced per change?
Convert both to cost per wound per week using achieved wear time. Divide the per-piece price by achieved wear days and multiply by seven; do the same for the per-change price using the number of changes per week. The conversion, not the price list, determines the ranking.
Does a longer labelled wear time always lower total cost?
No. The label is a ceiling. The saving materialises only if achieved wear time actually rises in practice and the unplanned-change rate does not rise with it. If local visit logistics mean the dressing is changed at the next scheduled visit regardless, a longer-wearing product may save nothing in labour.
How should I treat silver and PHMB dressings differently in the cost model?
Treat them identically as cost lines. Any difference enters through wear time, change frequency, and secondary-supply requirements. Antimicrobial selection is a clinical and stewardship decision that the cost model should inform but not drive.
What documentation should I request before entering a supplier into the matrix?
The current IFU, the specification sheet, the certification pack with scope pages, a declaration of device classification and intended purpose, and a sampling plan. Verify QMS certificates for current validity and revision directly with the issuing body.
How many sensitivity cases are enough for a tender submission?
Three — base, downside, and upside — are usually sufficient to show the range and the crossover, provided every non-varied input is held fixed and each case is labelled. More cases add presentation burden without adding decision value.
Can I run this model without local change-frequency data?
Yes, with stated assumptions and a sensitivity range. But flag clearly that the unplanned-change probability is the input most sensitive to local practice, and the one most worth collecting before submission — it is also the input a committee is most likely to challenge.
Conclusion and next steps
The dressing with the lowest unit price is frequently not the lowest total therapy cost once wear time, leakage, and nursing time are modelled. That is the guide’s central claim, and it rests on a simple structure: four cost lines, one denominator, and a separate probability-weighted line for the changes that were never scheduled.
Recap the mechanics. Cost per wound per week is the only comparable unit. The four lines are the primary dressing amortised over achieved wear time, secondary supplies and fixation allocated per change, leakage and unplanned changes weighted by probability, and clinician time at the local loaded rate. Scheduled and unplanned changes are modelled separately so the leakage penalty is visible rather than buried. And the three-case sensitivity — base, downside, upside, with every non-varied input held fixed — is what turns a point estimate into a decision the committee can defend.
The next step is procurement-grade and specific: request the IFU, specification sheet, certification pack, and sampling plan from each shortlisted supplier, populate the SKU matrix from those controlled documents, and run the three sensitivity cases on your own wound-type cohort before the next tender window. If the local data is thin, state the assumptions, run the range, and present the crossover threshold as the number to act on. That is a stronger submission than a price list, and it is the one a value-analysis committee can actually use.